On sprawl and connectedness in notetaking
In 1929, Hungarian writer Frigyes Karinthy published a short story speculating that anyone on Earth should be able to reach anyone else via a short chain of personal acquaintances. One would pass a message to a friend, who would pass it on to their friend, and so on.
I have never attempted to test Karinthy’s idea, now best-known by the truism of “six degrees of separation.” I have never needed to: I have felt its truth in dozens of “small world” moments: in a place full of strangers, bumping into someone I know. Or discovering that two friends I know from completely different contexts also know each other independently.
I treasure these moments. They make the world feel cozy and friendly and full of meaning. Such moments, and such feelings, can come from recognizing connections between objects and events and ideas as well as people. Karinthy recognized this in his short story, writing in a translation by Adam Makkai: “The strange mind-game that clatters in me all the time goes like this: how can I link, with three, four, or at most five links of the chain, trivial, everyday things of life. How can I link one phenomenon to another? How can I join the relative and the ephemeral with steady, permanent things — how can I tie up the part with the whole?”
I love writing which conveys this feeling: W. G. Sebald’s novels, Benjamin Labatut’s short stories, Mark Doty’s essays, Alison Bechdel’s graphic memoirs, Lawrence Weschler’s profiles, Laurie Anderson’s lyrics. All of these sprawl and wander, then return via improbable but irrefutable chains of association to objects of persistent fascination.
The world is more full of these connections than we know. What follows is a system for using writing to play Karinthy’s “strange mind-game” to find connections that tie the whole network of things and ideas into a tight web, dense with meaning.
To use writing in pursuit of connectedness, it helps to make the connections between things explicit. The first step is to break writing down into small units, or notes.
This is a note.
Mentioning one note within the text of another creates a connection between the two notes.
I call a collection of interlinked notes a notegraph.
A serious notetaker cultivating an "evergreen" notegraph can easily add dozens of notes every month. But as the notegraph grows, linking new notes becomes increasingly difficult. With a digital notegraph, it is easy to search for existing notes using the same keywords as a new note. But these connections are the least interesting ones. The notegraph is not a database for recording obvious connections — the ones on the surface — but a tool for finding unexpected connections.
Keyword search, then, is no use for finding non-obvious connections. How else can a notetaker play Karinthy's "mind game," looking for connections to bind the whole notegraph more tightly together?
One strategy is to start with a keyword search, then explore outward from those "obvious" notes, hopping from note to note via the existing links. Of course, this approach is still skewed towards the boring obvious connections. More importantly, because it relies on the existing link structure, this approach is unlikely to hit upon relevant-but-neglected notes.
Another strategy is to explore the notegraph randomly. This can be fun, but in a large notegraph rarely turns up promising connections.
If only there were some heuristic for finding unexpected connections between notes!
Short of such a heuristic, we might wish for a way of knowing which notes, if linked, would increase the overall connectedness of the notegraph. In Karinthy's story, this would be like finding two strangers with different wide networks of friends. Introducing those well-connected strangers — assuming they come to like and trust each other — could make it easier for the friends of one to reach the friends of other. Adding a single connection could make the whole network much more connected.
Just as I'm not very good at predicting when two friends of mine will hit it off, I don't know of any better way to tell whether two notes will resonate than to put them side-by-side. But I can tell how linking two notes would affect the connectedness of the whole notegraph.
In what follows, I describe a method for doing just that.
One way to assess how adding a link will change the overall structure of a network is to visualize it.
This common visualization draws a dot for each note and a line for each link.
Although some popular notetaking tools offer similar visualizations, I seldom find the visualizations helpful, since on large notegraphs, they quickly become cluttered and inscrutable.
(The next few pages include visualizations because, for small notegraphs like the ones here, the visualizations make it easier to think of the notegraph as a whole).
To find "well-connected strangers" in a large notegraph, we need more than a visualization.
If we can measure the connectedness of a notegraph with some computation that condenses its complexity into a single number, then we can compare different versions of a notegraph. We can simulate "introducing" (linking) many pairs of "strangers" (unlinked notes) and measure how much each "introduction" increases the notegraph's overall connectedness. Many of these "introductions" won't work out because the notes they link don't have enough in common. Even though the measurement is algorithmic, the essential work of cultivating the notegraph is still human: only the notetaker can judge whether two notes resonate with each other.
Since I want the "small-world" feeling Karinthy describes — the feeling that everything is closely related to everything else — I choose a measure based on the number of links required to travel between notes. I call this sprawl:
Sprawl is in the inverse of connectedness, meaning that a notegraph with large sprawl is poorly-connected, while a notegraph with low sprawl is well-connected. Or, succinctly: big sprawl, bad; small sprawl, good. Finding links which reduce sprawl is the key to improving a notegraph's connectedness.
Before I share how I've used this measure to weave my own notegraph more tightly together, here are a few examples showing how it works on simple notegraphs.
This notegraph contains only a single pair which can be traversed in one hop, so it has a sprawl of one.
This notegraph has a slightly higher sprawl because its ends are further apart.
In general, for a notegraph structured as a chain, like this one, sprawl will increase in proportion to the number of notes (i.e. the length of the chain). With a long enough chain, the sprawl can be made as high as you like.
Don't get hung up on the precise values of sprawl: these values don't mean anything in isolation. It doesn't matter whether a notegraph has a sprawl of 1 or 1.33. The important thing is to gain a feel for the relative scale of sprawl: how and why one notegraph sprawls more than another, and how a sprawling notegraph might be altered to make it more connected.
This notegraph has the same number of notes as the previous one, but because the ends of the chain have been joined up, it has a lower sprawl.
In fact, this is the lowest possible sprawl. A sprawl of one means that every note is directly connected to every other note. It's not possible to be any more connected than that!
Hindu scripture describes a vast structure called Indra's Net, an infinite web strung with pearls, each pearl reflecting every other infinite pearl. In Indra's Net, everything is connected to everything else. But in a real notegraph with dozens or hundreds of notes, most notes are not directly connected to each other. This means that sprawl in a typical notegraph is always greater than one. If the notegraph has "six degrees of separation," then its sprawl will be less than six.
The matrix below shows the distance between each pair of notes. Every note in the notegraph has a row in the matrix, shown by the colored cells along the left side of the matrix. Every note also has a column shown by the colored cells along the right side of the matrix. Each non-colored cell belongs to exactly one row and one column and so represents a pair of notes. The numbers in the cells show the distance between the two notes. Some cells are grayed-out to avoid pairing a note with itself or counting the same pair twice.
You can click to visualize the shortest path between each pair on the accompanying diagram.
This notegraph is simple and symmetrical, but the notegraphs in the following pages are more complex. Matrices like this one help show how each pair contributes to the notegraph's overall connectedness.
This is a slightly more complicated notegraph.
There is variation in the distance between notes.
With more nodes but only a few more edges, this notegraph has the largest sprawl of any we've seen yet.
These notes, jotted down hastily, are just a beginning — but already they begin to sprawl. If I wanted to weave these scattered thoughts more tightly together, where should I start?
The visualization suggests that the quickest way to bring everything closer together is to find a way to connect the two "ends" of the notegraph: the note on the left (
We can use the sprawl metric to check the intuition from the visualization. For every pair of notes without a direct link, we can calculate the sprawl that the notegraph would have if those notes were to be linked. Sometimes, it is possible to directly add a link between two existing notes. But more often, linking two notes requires adding a new note. We model this by calculating the sprawl that results from adding a new note along with two links to existing notes.
The matrix at the top of the page shows the length of the shortest path between each pair of notes, all of which combine to give the sprawl. The matrix below shows the reduction in sprawl for every link that we might add (larger numbers are better; they indicate a greater reduction in sprawl). The four cells with a "-" correspond to the four links already in the notegraph. Since those pairs of notes are already linked, there is nothing to be gained by adding another link between them.
Again, don't worry about the specific sprawl values in this matrix. What matters are their relative magnitudes: a little bit positive, neutral, a little bit negative.
The sprawl calculations show that our options are more evenly divided than we might have guessed. Linking
The sprawl calculations also shows where to avoid focusing attention. Adding a note along with two links joining
Following the guidance of the speculative sprawl calculations, this notegraph adds a new note (
Sure enough, this notegraph is less sprawling (more connected) than before.
A link assistant is a tool which identifies and recommends interventions in a notegraph to reduce its sprawl. The matrix on the previous page was a kind of link assistant. That format quickly becomes unwieldy on larger notegraphs, though. A more useful link assistant might present just the 10 most promising pairs of unlinked notes.
Using a link assistant is not about automating writing or making it easier. In extending the notegraph from the previous page, the sprawl calculations gave me three options. But I still had to choose one of them, and I still had to do the work of writing. Calculating the sprawl of my notegraph does not eliminate my agency as a writer, but helps me to focus it.
I have been using a link assistant to guide my writing with my own notegraph for more than a year. In that time, my link assistant has shown me duplication within my notegraph and helped me consolidate it.
It has occasionally surfaced unlikely connections: its juxtaposition of Arctic sea iceberglets with ancient Babylonian clay objects covered in cuneiform brought to my mind the beautiful image of storms leaving snow-writing on the Arctic glaciers, to be read centuries later by the sea.


Once, my link assistant delivered a recommendation so opportune and apt that I felt it might have been analyzing my private thoughts in real time. I was on vacation in the Netherlands and had spent one afternoon looking at seventeenth-century Dutch paintings. The next day, I visited a house built for an early-twentieth-century industrial magnate. That evening, when I opened my notegraph and consulted my link assistant, its top suggestion was to link a note on Dutch paintings to another on rich people’s houses. I had written both notes more than a year earlier, and had added little to them since.
On reading the suggestion, I experienced a moment of perfect synchrony: as though my notegraph were a part of me and my link assistant an extension of my thoughts. This was exactly the small-world feeling I had hoped my link assistant would help me find. I think Karinthy would have appreciated it.
I treasure these moments, but I don't count on them. There are other, more everyday reasons I've persisted for more than a year in trying to make my notegraph more connected.
I like to collect things. I delight in jotting down names and phrases, saving links, taking pictures, and organizing all of these things into lists and albums. Squirreling away wonderful things for use in some future project, I feel a pleasurable sense of abundance. I like to imagine that my collection of notes, like a slowly-accumulating cloud of interstellar gas, might one day acquire sufficient density to ignite and begin producing new ideas of its own accord. But as long as I file my encounters away without working to integrate them, sense of abundance fades rapidly. Rather than bursting into light, the collection congeals into a dull mass.
When, shortly after reading How To Take Smart Notes, I started my own notegraph, I was determined to keep its contents alive in my mind. I didn't want it to become another yet another information attic overstuffed with forgotten facts. I envisioned the notegraph as the focus of a lifelong writing practice, a tool for integrating my past and present into a single consistent and continuous self. But I found it all too easy revert to my old habit of gathering things and making lists.
Calculating the sprawl of my notegraph and trying to increase its connectedness helps me curb my hoarding instinct. It draws my attention from a single note out to the notegraph as a whole.
It is a cliché to observe that measurement drives behavior. Still, it's true. When the number of notes is the only measure of my notegraph, I add notes with abandon. When I measure connectedness, I find myself cultivating connections. If I cannot overcome the impulse to optimize any number I see, at least I can channel it.
I still want my notegraph to ignite new ideas, but I no longer believe that will happen through the mere accumulation of notes. Connections between notes supply the "gravity" binding the notegraph together, and it's up to me to articulate those connections.
So far, I have found my notegraph most useful for open-ended reflection. When I am working on a specific project (an essay, a short story), I create a separate workspace (which could be an ephemeral spin-off notegraph, or simply a flat document). I've found that the false starts of a writing project quickly clog my primary notegraph. The timescales and the paces are too different: one accumulates slowly over a lifetime, the other over weeks or months. Still, when I'm done with a project, I bring the promising unexpressed ideas back into my primary notegraph. Everything comes back together in the end.
That's it! You've made it all the way to the end.
Thanks to everyone who helped me refine the ideas in this essay:
- Andy Matuschak for letting me calculate the sprawl of his personal notegraph and for spending time to give honest, thoughtful feedback about the usefulness (and uselessness!) of the ensuing connectedness-maximizing link recommendations.
- Michael Webb, Ione Barrows, Saffron Huang, and Celine Bondoc for providing feedback on early drafts and prototypes of this interactive essay.
I made the graph diagrams with Cytoscape.js and laid out the mathematical formulas with MathJax. Except for those libraries, this tutorial is driven exclusively by vanilla Custom Elements without any web framework.
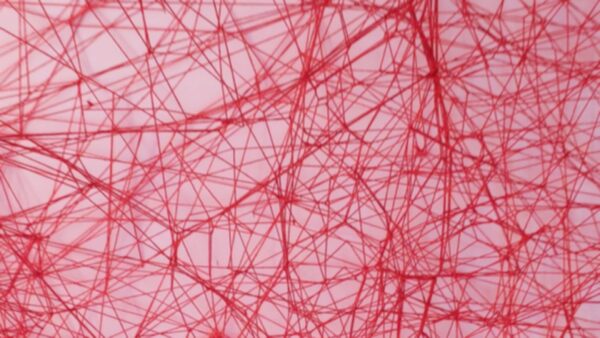
The cover image shows Chiharu Shiota's intervention at the Hammer Museum in Los Angeles, taken by yours truly.